See Solution
Sensor IT IoT Dashboard
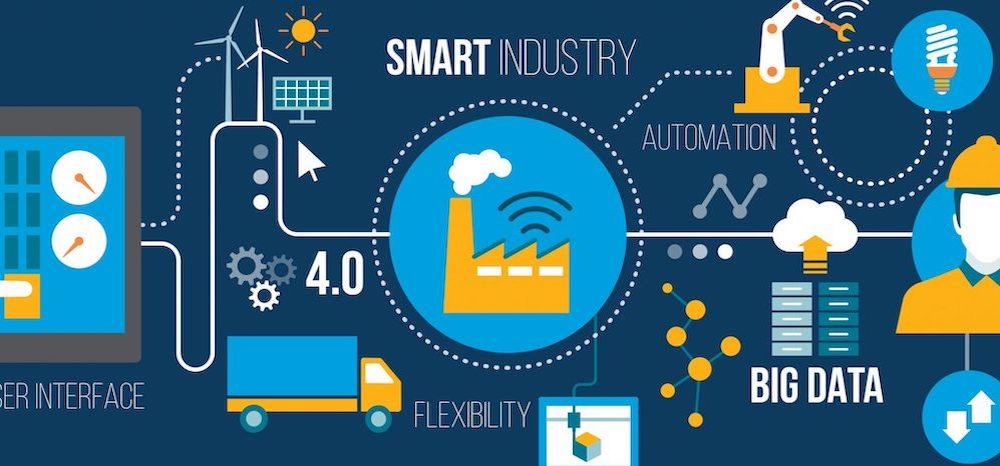
The Sensor IT IoT Dashboard is a cloud-based Smart interface that collects, visualises, and analyses data from connected sensors in real time. It helps users monitor conditions, detect anomalies, and make data-driven decisions across various environments like industrial sites, smart buildings, or agriculture.
Features of the Sensor IT IoT Dashboard
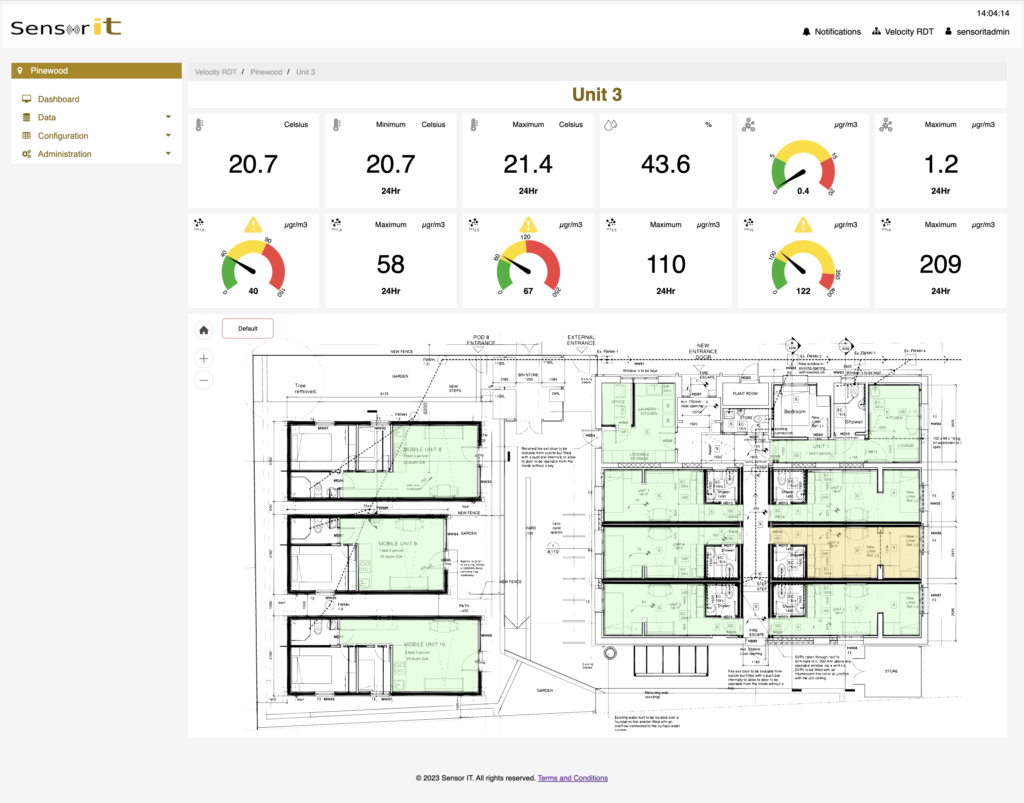
- Cloud-based Dashboard. All our monitors implement full connectivity. The data being sent is collected and presented in real-time through a cloud-based dashboard and/or mobile application.
- Real-Time Data Visualization: Live dashboards update instantly with data from connected sensors and devices.
- Customizable Widgets & Views: Tailor layouts, charts, and alerts to match specific operational needs or user roles.
- Geolocation & Mapping: Visualize asset locations on interactive maps, ideal for fleet tracking, smart cities, or logistics.
- Advanced Alerts & Thresholds: Set conditional alerts (SMS, email, in-app) for anomalies, downtime, or critical thresholds.
- Historical Data & Trend Analysis: Access and compare historical data trends for better forecasting and reporting.
- Role-Based Access Control: Securely manage who can view, edit, or control different elements of the dashboard.
- API & Third-Party Integration: Connect with existing platforms via REST APIs or MQTT brokers.
- AI & ML Integration. Which allows for predictive Analytics, anomaly Detection and automated Decision-Making
Sensor IT’s IoT Dashboard is designed to deliver actionable insights and seamless monitoring across any IoT ecosystem. Key features include:
Benefits of Real-Time IoT Monitoring
Real-time monitoring transforms data into operational efficiency. Here’s how:
Instant Response to Issues: Identify problems as they occur and take immediate action, reducing downtime and damage.
Improved Operational Visibility: Gain a clear, centralized view of your entire infrastructure or process in one dashboard.
Data-Driven Decision Making: Make proactive decisions backed by continuous data and predictive analytics.
Enhanced Safety & Compliance: Monitor temperature, air quality, pressure, or vibration in real time to prevent accidents or violations.
Cost Optimization: Detect inefficiencies, reduce energy waste, and optimize resource allocation with live data insights.
Why Choose Sensor IT for IoT Visualization?
Sensor IT is an Internet of Things specialist. As such, there are not many Technology Providers that are better placed than us out there to provide, integrate and customise an IoT Dashboard.
Proven Expertise
Built by experts in IoT, industrial automation, and digital transformation
Rapid Deployment
Launch your dashboard quickly with pre-configured templates and onboarding support
Security and Privacy
Data encryption, access controls, and GDPR-compliant practices ensure data is safe
Support
Get assistance from integration to long-term success, including custom feature development
Custom Development
Sensor IT IoT Dashboard can be tailored, customised and integrated to suit individual needs and requirements
Cost Effective
Flexible plans that scale with your usage and project needs—no hidden fees
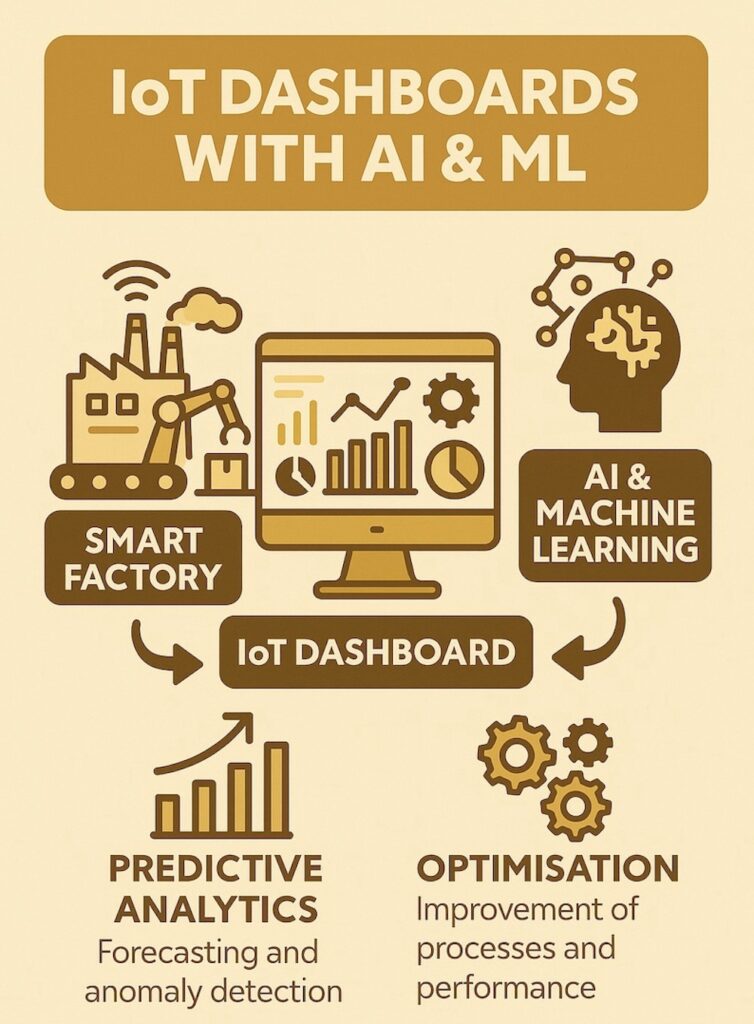
IoT Dashboard AI and ML
IoT Dashboard Artificial Intelligence (AI)
Artificial Intelligence is a game-changer for IoT dashboards because it transforms raw sensor data into smart insights. Instead of just displaying numbers and charts, AI can detect patterns, predict failures, and recommend actions in real time. This means users don’t have to constantly monitor the dashboard—they’re alerted only when something important happens. AI also helps personalize the interface, showing the most relevant data based on context and usage. Ultimately, it makes IoT systems more efficient, proactive, and user-friendly.
IoT Dashboard Machine Learning (ML)
Machine learning enhances IoT dashboards by enabling systems to learn from data over time and continuously improve performance. Instead of relying on static rules, ML models adapt to changing conditions, making predictions—like when a machine might fail or how to optimize energy usage—based on historical and real-time data. This turns the dashboard from a passive display into an intelligent assistant that uncovers hidden trends, automates decision-making, and delivers actionable insights. With ML, IoT dashboards evolve from monitoring tools into powerful engines for optimization and foresight
Use Cases
Sensor IT’s IoT Dashboard is built to serve diverse sectors:
Industrial Automation: Monitor machine health, production line efficiency, or environmental conditions in real time.
Healthcare Facilities: Track patient environments, temperature-controlled assets (like vaccines), and equipment usage.
Smart Buildings: Manage HVAC, lighting, occupancy, and energy consumption across large campuses.
Logistics & Transportation: Monitor vehicle telemetry, route efficiency, cold chain integrity, and fleet location.
Agriculture & Environment: Track soil moisture, weather patterns, and greenhouse conditions for smarter farming.